As a researcher and writer on education, I have two major areas of interest:
1) Multi-sensory approaches to writing and reading
2) Educational policy
I created this website in the hope that someone might stumble upon it and find something useful from the articles (100+), chapters (30), or books (13). If you'd like a copy of an article or a chapter from a book, just drop me an email: lawrencebaines@gmail.com.
Strategy 8. Seek out diverse experiences from What's a parent to do?
“The tendency of people to seek out those they perceive to be most like themselves” is known as homophily.i Homophily becomes quickly evident at large gatherings involving different kinds of people. At gatherings where employees from across the United States come to meet, for example, people from the same region will tend to congregate. At faculty meetings in schools, teachers with expertise in the same areas will inevitably sit together. In the hundreds of times that I have given talks in schools, all the school’s coaches have clustered together, without fail.
The impulse towards homophily is strong, natural, and completely understandable. We like to associate with people with whom we share interests—a job, a hobby, or an affiliation.ii Homophily explains the popularity of fraternities, sororities, alumni associations, and organizations such as Rotary, Shriner’s, and Veterans of Foreign Wars.iii
The downside of homophily is that spending time with others who share your interests can limit your own perspectives, eliminate possibilities for novel experiences, and reduce the likelihood of finding new friends. Someone susceptible to homophily can become territorial and distrustful of anyone outside of the group to which he/she belongs.iv
Because social groups tend to be formed around like-mindedness on specific issues—Black Lives Matter or Back the Blue—any opinion other than the one held to be legitimate within the social circle is rarely even acknowledged.v As a result, sometimes a story spreads within groups, even after it has been proven to be blatantly false.vi
Examples include the persistent belief among some people that former President Barack Obama is not a U.S. citizen, despite confirmation of the authenticity of his birth certificate and the evidence of hospital records,vii or that humans have not really walked on the moon, despite the overwhelming evidence of moon expeditions completed by astronauts from different countries around the world.viii
As a parent, it is easy to succumb to homophily. That is, it is easy to fall into a pattern where you and your child interact only with others who look, behave, and think just as you do.
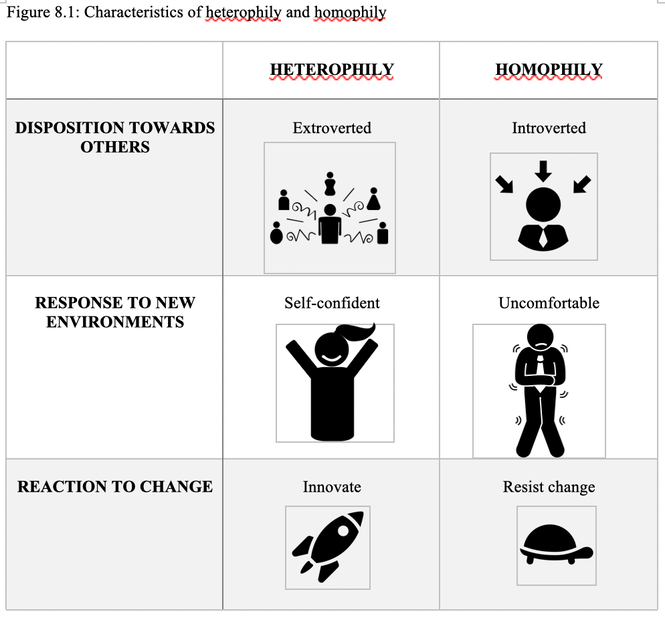
The opposite of homophily is heterophily, or the “tendency for individuals who differ from one another in some way to make social connections.”ix In general, individuals who tend towards heterophily are more extroverted, self-confident in new environments, and attracted to innovation while individuals who tend towards homophily are more introverted, uncomfortable in new environments, and resistant to change.x Characteristics of homophily and heterophily are depicted in Figure 8.1.
“The tendency of people to seek out those they perceive to be most like themselves” is known as homophily.i Homophily becomes quickly evident at large gatherings involving different kinds of people. At gatherings where employees from across the United States come to meet, for example, people from the same region will tend to congregate. At faculty meetings in schools, teachers with expertise in the same areas will inevitably sit together. In the hundreds of times that I have given talks in schools, all the school’s coaches have clustered together, without fail.
The impulse towards homophily is strong, natural, and completely understandable. We like to associate with people with whom we share interests—a job, a hobby, or an affiliation.ii Homophily explains the popularity of fraternities, sororities, alumni associations, and organizations such as Rotary, Shriner’s, and Veterans of Foreign Wars.iii
The downside of homophily is that spending time with others who share your interests can limit your own perspectives, eliminate possibilities for novel experiences, and reduce the likelihood of finding new friends. Someone susceptible to homophily can become territorial and distrustful of anyone outside of the group to which he/she belongs.iv
Because social groups tend to be formed around like-mindedness on specific issues—Black Lives Matter or Back the Blue—any opinion other than the one held to be legitimate within the social circle is rarely even acknowledged.v As a result, sometimes a story spreads within groups, even after it has been proven to be blatantly false.vi
Examples include the persistent belief among some people that former President Barack Obama is not a U.S. citizen, despite confirmation of the authenticity of his birth certificate and the evidence of hospital records,vii or that humans have not really walked on the moon, despite the overwhelming evidence of moon expeditions completed by astronauts from different countries around the world.viii
As a parent, it is easy to succumb to homophily. That is, it is easy to fall into a pattern where you and your child interact only with others who look, behave, and think just as you do.
The opposite of homophily is heterophily, or the “tendency for individuals who differ from one another in some way to make social connections.”ix In general, individuals who tend towards heterophily are more extroverted, self-confident in new environments, and attracted to innovation while individuals who tend towards homophily are more introverted, uncomfortable in new environments, and resistant to change.x Characteristics of homophily and heterophily are depicted in Figure 8.1.
Seeking out diverse experiences takes concerted, purposeful effort unless your social circle already happens to include families with different ethnicities, cultures, or incomes.
The international consulting firm McKinsey & Company recently completed a series of reports on diversity, and found that businesses that recruited and kept a multicultural workforce tended to have greater profitability, higher employee satisfaction, and higher productivity than businesses that employed a monocultural workforce.xi In light of rapid changes in technology and burgeoning globalized trade, the World Economic Forum recommends that new workers possess strong “critical thinking and analysis” abilities, as well as self-management skills, such as “active learning, resilience, stress tolerance, and flexibility.”xii
Of course, homophily and heterophily are only concepts and most children display a mixture of both tendencies, depending upon the time and place. Not every experience has to be novel, but new experiences can be invaluable for brain-building and the development of compassion.xiii
Experts contend that future workers will need to be able to process complex information and be capable of working well with people from all backgrounds.xiv Critical thinking skills can be developed and honed by purposefully seeking out diverse populationsxv and learning how to foster “intercultural exchange across different kinds of cultural groups.”xvi
Understanding the “decision-making processes and belief systems of other people”xvii is considered a foundational skill for the future.xviii Writer Yuval Harari suggests that schools adopt the teaching of “the four Cs”—critical thinking, communication, collaboration and creativity.”xix
Sometimes children seem incapable of seeing themselves as someone else might see them.xx To be sure, any sort of self-reflection is difficult for the very young.xxi One great advantage of travel is that it can help build an awareness of different ways of being at almost any age, even among children who are not naturally self-reflective.xxii In this way, travel is good for the mind, helping foster “self-identity, skill development, and social relations.”xxiii Indeed, travel to an unfamiliar destination can provide memorable learning experiences that can remain lodged in the brain indefinitely.xxiv
Certainly, few experiences are more humbling than attempting to navigate in an unfamiliar country where you do not speak the language. Travelers to foreign lands are often forced to adjust to different ways of living, what academics call “dialectically opposed modes of adaptation to the world.”xxv The disequilibrium that accompanies travel forces the mind to work harder and more imaginatively,xxvi opening the space for new experiences.xxvii
The scholar Joseph Campbell always credited his prodigious achievements, in part, to his parents’ dedication to a sustained program of travel for he and his brother.xxviii Travel does not have to last months in order to have an effect; studies have shown that even short-term travel, such as a trip to a nearby beach or a local zoo, can be transformative.xxix
Mark Twain wrote that “Travel is fatal to prejudice, bigotry, and narrow-mindedness…. Broad, wholesome, charitable views of men and things cannot be acquired by vegetating in one little corner of the earth all one’s lifetime.”xxx While visiting other countries can be fun and enlightening, travel to sites in the neighborhood also can make a significant impact.xxxi
Exploring nearby parks, visiting museums, touring manufacturing plants, talking with local artists, participating in charity events, listening to presentations by local librarians, conversing with park rangers--these activities cost nothing and readily satisfy the young mind’s appetite for variety.
Story
A long-time teacher in a public school in Corpus Christi, a bustling city located along the Gulf of Mexico in South Texas, once told me that she was astounded to have adolescents in her classes who had lived in Corpus their entire lives, but had never been to the beach at Padre Island. Not once.
To go from the school where she taught to Padre Island required heading south and crossing one bridge—a trip of less than 10 miles. As a teacher, she always felt that students who had never been to Padre Island were the very ones who would have benefitted the most from it. That is, she said that the students who had never been to the beach were also the students who seemed most anxious, stubborn, and inflexible in their thinking. They also tended to have the lowest achievement scores.